\( \DeclareMathOperator{\abs}{abs} \newcommand{\ensuremath}[1]{\mbox{$#1$}} \)
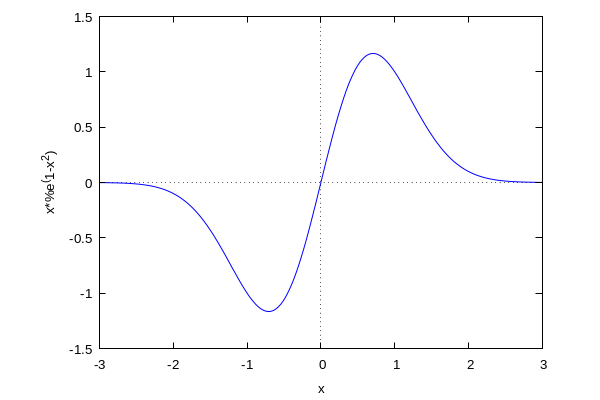
| (%i2) |
f(
x)
:
=
x
*
%e
^(
1
-
x
^
2)
$
wxplot2d( f( x),[ x, - 3, 3]) ; |
Recordemos que una función doblemente diferenciable es cóncava en un intervalo si su segunda derivada es negativa en él; si es positiva será convexa.
| (%i4) |
define(
df2(
x),
diff(
f(
x),
x,
2))
;
wxplot2d( df2( x),[ x, - 3, 3]) ; |
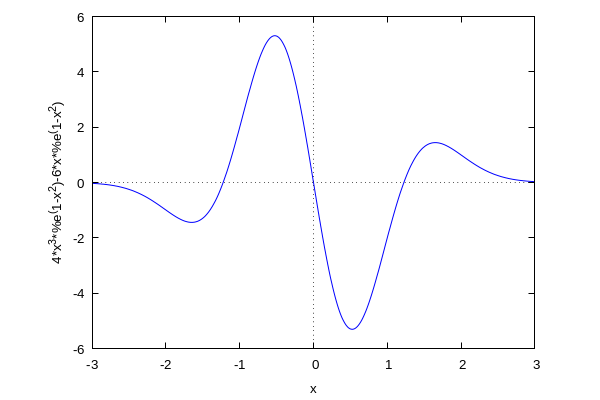
Necesitamos los puntos donde df2(x) se hace cero, para eso utilizaremos find_root()
| (%i5) |
ceros
:[
find_root(
df2(
x),
x,
-
2,
-
1),
find_root( df2( x), x, 1, 2)] ; |
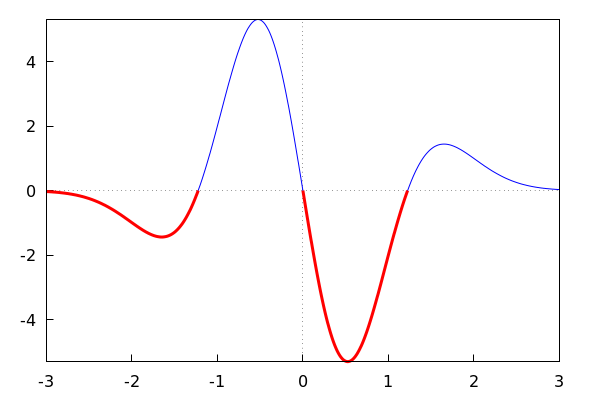
| (%i6) |
wxdraw2d(
filled_func
=false,
fill_color
=
blue,
explicit(
df2(
x),
x,
-
3,
3),
filled_func =false, color = red, line_width = 3, explicit( df2( x), x, 0, ceros[ 2]), filled_func =false, color = red, line_width = 3, explicit( df2( x), x, - 3, ceros[ 1]), xaxis =true, yaxis =true) ; |
Created with wxMaxima.
Dibujemos la función: